Digital marketing statistics guide your strategy, offering insights into consumer behavior and market trends. They help tailor your efforts for maximum engagement, ensuring resources are efficiently allocated. By understanding these metrics, businesses can create targeted campaigns, optimize their online presence, and stay ahead of the competition. Essentially, they empower decision-making with data-driven clarity, enhancing the effectiveness of digital marketing initiatives.
Navigating the world of digital marketing without data is like sailing without a compass.
Without insights from digital marketing statistics, businesses risk missing out on key trends, consumer behaviors, and opportunities for growth.
Leverage the power of data to steer your strategy in the right direction.
Check out this list of digital marketing statistics to get started.
Overview
General Digital Marketing Statistics
- By 2019, video will account for 80% of global internet traffic, and 85% in the US (Cisco).
- The average CTR of display ads is .06% (HubSpot).
- The CTR for native ads is more than double regular display ads: .33% for mobile, .16% desktop (Business Insider).
- Users who are retargeted to are 70% more likely to convert (HubSpot).
Conversion Rate Optimization (CRO)
- Only about 22% of businesses are satisfied with their conversion rates. (Econsultancy, 2016)
- For every $92 dollars spent acquiring customers, only $1 is spent converting them. – Econsultancy
- Using videos on landing pages can increase conversions by 86%. – Eyeview
- 60% of online marketers plan to do customer journey analysis to improve their online conversion rate. – MarketingCharts
Local SEO
- 72% of consumers who did a local search visited a store within five miles. (Google, 2014)
- 30% of mobile searches are related to a location. (Google, 2016)
- 28% of searches for something nearby result in a purchase. (Google, 2016)
- Local searches lead 50% of mobile visitors to visit stores within one day. (Google, 2014)
- 78% of local-mobile searches result in offline purchases. (Search Engine Land, 2014)
Organic Search
- Google gets over 2 trillion searches per year. (Search Engine Land, 2016)
- The average Google first page result contains 1,890 words. (Backlinko, 2016)
- 50% of search queries are four words or longer. (WordStream, 2016)
- 66% of marketers say improving SEO and growing their organic presence is their top inbound marketing priority. (HubSpot, 2016)
- 71% of B2B researchers start their research with a generic search. (Google, 2015)
- B2B researchers do 12 searches on average prior to engaging on a specific brand’s site. (Google, 2015)
- 72% of marketers say relevant content creation was the most effective SEO tactic. (Ascend2, 2016)
- 40% of marketers say the most challenging obstacle to search engine optimization success is changing search algorithms. (Ascend2, 2015)
Mobile
- 84 percent of mobile advertisers believe they’re providing a positive experience. Less than half of consumers report their experience was positive. (Unlockd)
- We have reached the mobile tipping point: All new data consumption is coming from mobile (TechCrunch).
- Over a third of email subscribers read their newsletters exclusively on mobile devices (Informz).
- 61% of users are unlikely to return to a mobile site after a negative experience. 40% will go to a competitor’s site (MicKinsey& Company).
- More Google searches take place on mobile devices than on computers in 10 countries including the U.S. and Japan. (Google, 2015)
- 49% of B2B researchers who use their mobile devices for product research do so while at work. (Google, 2015)
- 65% of smartphone users agree that when conducting a search on their smartphones, they look for the most relevant information regardless of the company providing the information. (Google, 2015)
- 51% of smartphone users have discovered a new company or product when conducting a search on their smartphone. (Google, 2015)
- 48% of consumers start mobile research with a search engine. (Smart Insights, 2017)
- 26% of consumers start mobile research with a branded app. (Smart Insights, 2017)
Voice Search
- 19% of people use Siri at least daily. (HubSpot, 2015)
- 37% use Siri, 23% use Microsoft’s Cortana AI, and 19% use Amazon’s Alexa AI at least monthly. (HubSpot, 2015)
- 20% of search queries on Google’s mobile app and on Android devices are voice searches. (Search Engine Land, 2016)
- 60% of smartphone users who use voice search have begun using it within the past year, with 41% of survey respondents having only begun to use voice search in the past six months. (Search Engine Land, 2016)
- 43% of mobile voice search users do so because they say it is quicker than going on a website or using an app. (Statista, 2015)
- 21% of mobile voice search users do so because they say they don’t like typing on their mobile. (Statista, 2015)
Ecommerce
- 81% of shoppers conduct online research before making big purchases. (Adweek, 2014)
- 44% of people go directly to Amazon to start their product searches, compared to 34% who use search engines like Google, Bing, and Yahoo to search for products. (Marketing Land, 2015)
- Mobile commerce makes up 30% of all U.S. ecommerce. (Internet Retailer, 2015)
Content Marketing
- 73% of surveyed consumers found that content with a strong personality helps in forming loyal relationships (Econsultancy).
- Marketers who prioritize blogging are 13x more likely to realize a positive ROI (Socialemedia).
- 61% of the most successful content marketers have a documented strategy, while only 2% of the least successful have one (CMI).
- 85% of the most successful deliver content consistently (CMI).
- 87% of the most successful say they are able to quickly adjust their content marketing strategy (CMI).
Blogging
- Marketers who prioritize blogging are 13x more likely to realize a positive ROI (Socialemedia).
- 60% of marketers say blog content creation is their top inbound marketing priority. (HubSpot, 2016)
- 1 in 10 blog posts are compounding, meaning organic search increases their traffic over time. (HubSpot, 2016)
- Compounding blog posts make up 10% of all blog posts and generate 38% of overall traffic. (HubSpot, 2016)
- Over its lifetime, one compounding blog post creates as much traffic as six decaying posts. (HubSpot, 2016)
- Companies that published 16+ blog posts per month got almost 3.5X more traffic than companies that published 0-4 monthly posts. (HubSpot, 2015)
- B2B companies that blogged 11+ times per month had almost 3X more traffic than those blogging 0-1 times per month. (HubSpot, 2015)
- B2C companies that blogged 11+ times per month got more than 4X as many leads than those that blog only 4-5 times per month. (HubSpot, 2015)
- Companies that published 16+ blog posts per month got about 4.5X more leads than companies that published 0-4 monthly posts. (HubSpot, 2015)
- 75% of HubSpot’s blog views and 90% of blog leads come from old posts. (HubSpot, 2014)
- Some 15% of internet users read or comment on discussion forums such as reddit, Digg, or Slashdot, while 10% use the blogging website Tumblr. (Pew Research Center, 2015)
- 43% of people admit to skimming blog posts. (HubSpot, 2016)
- Titles with 6-13 words attract the highest and most consistent amount of traffic. (HubSpot, 2016)
Content Strategy
- 61% of the most successful content marketers have a documented strategy, while only 2% of the least successful have one (CMI).
- 87% of the most successful say they are able to quickly adjust their content marketing strategy (CMI).
- 8% of marketers plan to add Medium to their marketing efforts in the next 12 months. (HubSpot, 2016)
- On average, B2B marketers allocate 28% of their total marketing budget to content marketing. (CMI, 2016)
- Only 30% of B2B marketers say their organizations are effective at content marketing, down from 38% last year. (CMI, 2016)
- 55% of B2B marketers say they are unclear on what content marketing success or effectiveness looks like. (CMI, 2016)
- 32% of B2B marketers say they have a documented content marketing strategy. (CMI, 2016)
- 28% of B2B marketers say they have a documented editorial mission statement. (CMI, 2015)
- 47% of buyers viewed 3-5 pieces of content before engaging with a sales rep. (Demand Gen Report, 2016)
- 96% of B2B buyers want content with more input from industry thought leaders. (Demand Gen Report, 2016)
Social Media
- When social media is part of their buyer’s journey, customers tend to convert at a 129% higher rate. They are also four times as likely to spend significantly more than those without a social component (Deloitte).
- Reading or writing social media reviews and comments will influence the shopping behavior of 67% of consumers (PwC).
- The average internet user spends nearly two hours browsing social media networks daily (Telegraph UK).
- On average, brands only respond to only one out of eight social messages in 72 hours or fewer (Sprout Social).
- 64% of marketers have Snapchat accounts, but only 67% of those are active (AdWeek).
- 64% of marketers are using social media for six hours or more and 41% for 11 or more hours weekly. (Social Media Examiner, 2015)
- Nearly 19% of marketers spend more than 20 hours each week on social media. (Social Media Examiner, 2015)
- 83% of all marketers actively pursue social media marketing initiatives. (Aberdeen, 2016)
- As of 2015, 35% of all those 65 and older report using social media, compared with just 2% in 2005. (Pew Research Center, 2015)
- As of 2015, 90% of young adults use social media, compared with 12% in 2005. (Pew Research Center, 2015)
- Nearly one-third of the world uses social networks regularly. (eMarketer, 2016)
- 88% of marketers want to know how to measure their return on investment for social media activities. (Social Media Examiner, 2015)
- Only 42% of marketers say they are able to measure their social activities. (Social Media Examiner, 2015)
- 92% of marketers say that social media is important to their business. (Social Media Examiner, 2015)
- More than half of marketers who’ve been using social media for at least two years report it helped them improve sales. (Social Media Examiner, 2015)
- 90% of all marketers indicated that their social media efforts have generated more exposure for their businesses. (Social Media Examiner, 2015)
- By spending as little as six hours per week, 66% of marketers see lead generation benefits with social media. (Social Media Examiner, 2015)
- At least 61% of those investing a minimum of six hours per week in social media marketing saw improvements in search engine rankings. (Social Media Examiner, 2015)
- 6 in 10 small business owners are not able to track ROI from their social media activities. (eMarketer, 2015)
Email Marketing
- Email marketing was the top channel for increase in digital marketing spend over the last year, with 61% of marketers increasing their investment (Relevate).
- Personalized email messages improve click-through rates and conversions by over 10% (Aberdeen).
- The average CTR for email marketing across industries is 3.2% (IBM).
- Last year, the average ROI for email campaigns was 4,300% (Copyblogger).
- 55% of all emails are opened on mobile devices (emailmonday).
Video Marketing
- 4X as many customers would rather watch a video about a product than read about it. (Animoto, 2015)
- Almost 50% of internet users look for videos related to a product or service before visiting a store. (Google, 2016)
- 53% of smartphone users feel more favorable towards companies whose mobile sites or apps provide instructional video content. (Google, 2015)
- 4 in 5 consumers believe that demo videos are helpful. Shoppers who view video are 1.81X more likely to purchase than non-viewers. (Animoto, 2015)
- 39% of marketers plan to add Facebook video to their content strategy in the next year. (Adobe, 2015)
- 45% of people watch more than an hour of Facebook or YouTube videos a week. (HubSpot, 2016)
- 100 million hours of video are watched every day on Facebook. (TechCrunch, 2016)
- 82% of Twitter users watch video content on Twitter. (Twitter, 2015)
- 90% of Twitter video views are on mobile. (Twitter, 2015)
- 55% of people consume video content thoroughly. (HubSpot, 2016)
- 43% of people want to see more video content from marketers. (HubSpot, 2016)
- Marketers who use video grow revenue 49% faster than non-video users. (Aberdeen, 2015)
- Nearly two-thirds of consumers prefer video under 60 seconds. (Animoto, 2015)
- 9% of marketing professionals worldwide name video as the type of content with the best ROI. (Adobe, 2015)
- YouTube 48% of marketers plan to add YouTube to their content strategy in the next year. (HubSpot, 2016)
- On mobile alone in an average week, YouTube reaches more 18+ year-olds during prime time TV hours than any cable TV network. (Google, 2016)
- Two-thirds of YouTube users watch YouTube on a second screen while watching TV at home. (Google, 2016)
- YouTube is more commonly used by larger businesses. For example, 71% of businesses with 100+ employees use YouTube, compared to 38% of the self-employed. (Social Media Examiner, 2015)
- YouTube has over a billion users, almost one-third of all people on the Internet. (YouTube, 2016)
- In an average month, 8 out of 10 18- to 49-year-olds watch YouTube. (Google, 2016)
- Among millennials, YouTube accounts for two-thirds of the premium online video watched across devices. (Google, 2016)
- The time people spend watching YouTube on their TV has more than doubled year over year. (Google, 2016)
Influencer Marketing
- Marketers receive an average of $6.85 in earned media value for every $1 spent on influencer marketing (AdWeek).
- Over 80% of marketing and communication professionals expect to begin an influencer marketing campaign within the year. (eMarketer).
- Influencer campaigns have proven effective for over 80% of marketers who have tried them (eMarketer).
- Customers acquired through word-of-mouth (such as influencer marketing) are retained at a 37% higher rate than those acquired through other means (Deloitte).
Lead Generation
- 80% of marketers report their lead generation efforts are only slightly or somewhat effective. (BrightTALK, 2015)
- Lack of resources, such as staff, funding, and time, remains the biggest obstacle to successful lead generation for 61% of B2B marketers. (BrightTALK, 2015)
- For B2B marketers, the ideal number of fields on web registration and download forms is between three and five for 79% of respondents, while only 16% said it was six or more. (BrightTALK, 2015)
- 53% of marketers say half or more of their budget is allocated to lead generation, while 34% say less than half of their budget is allocated to lead generation. (BrightTALK, 2015)
- Only 17% of marketers say outbound practices provide the highest quality leads for sales. (HubSpot, 2016)
- 65% of marketers say generating traffic and leads is their top challenge. (HubSpot, 2016)
- 58% of marketers say their lead generation budget will increase in the coming year. (BrightTALK, 2015)
- Nearly 80% of companies not meeting their revenue goals attract 10,000 monthly website visitors or less. For those exceeding their revenue goals, 70% report attracting more than 10,000 visitors per month. (HubSpot, 2015)
- The less companies know about their KPIs, the less likely they are to meet their revenue goals. 74% of companies that weren’t exceeding revenue goals did not know their visitor, lead, MQL, or sales opportunities. (HubSpot, 2015)
Advertising
- 87% of people say there are more ads than two years ago. (HubSpot, 2016)
- Adblocking has cost publishers nearly $22 billion in 2015 alone. (PageFair, 2015)
- Adblocker Plus, the most popular ad blocking app, has reached 300 million downloads worldwide. (HubSpot, 2016)
- 77% of consumers agree that they would prefer to ad filter than completely ad block. (HubSpot, 2016)
- 41% of ad blocker users found out about ad blockers by word of mouth. (HubSpot, 2016)
- 64% of ad blocker users do so because they believe ads are annoying or intrusive. (HubSpot, 2016)
- 419 million people worldwide have installed an ad blocker on their smartphone. (PageFair, 2015)
- 51% of people have a lower opinion of brands that use autoplaying video ads. (HubSpot, 2016)
- 70% of U.S. marketers plan to use social video ads in the coming 12 months. (eMarketer, 2016)
- 82% of consumers have closed a browser or exited a webpage because of an autoplaying online video ad. (HubSpot, 2016)
- YouTube’s net U.S. video ad revenues account for 18.9% of the U.S. digital video ad market. (eMarketer, 2014)
- Video ads have an average clickthrough rate of 1.84%, the highest clickthrough rate of all digital ad formats. (Business Insider, 2014)
- 56% of viewers are likely to skip online video ads. (Marketing Land, 2014)
- 15% of viewers believe a video ad should be no more than 15 seconds in length. (Marketing Land, 2014)
Sales
- 22% of salespeople don’t know what a CRM is. (HubSpot, 2016)
- 17% of salespeople cite manual data entry as the biggest challenge using their existing CRM. (HubSpot, 2016)
- Only 21% of salespeople consider their CRM software’s integration capabilities with marketing software or other tools to be high quality. (HubSpot, 2016)
- 40% of salespeople still use informal means such as Microsoft Excel or Outlook to store its lead and customer data. (HubSpot, 2016)
- 29% of salespeople are spending an hour or more on data entry each and every day. (HubSpot, 2016)
- Nearly half (45%) of companies are using some form of CRM to store lead data, and 84% of those companies have a standard in place for scoring lead quality. (DMN News, 2014)
- 70% of companies say closing more deals is their top sales priority. (HubSpot, 2016)
- Prospecting is the most difficult part of the sales process for salespeople. (HubSpot, 2016)
- 58% of buyers want to talk about pricing in the first sales call, while 65% of salespeople want to keep the conversation on goals. (HubSpot, 2016)
- 57% of salespeople believe buyers are less dependent on salespeople during the buying process. (HubSpot, 2016)
- Only 29% of people want to talk to a salesperson to learn more about a product, while 62% will consult a search engine. (HubSpot, 2016)
- 40% of salespeople say getting a response from prospects is getting harder. (HubSpot, 2016)
- 28% of companies are prioritizing social selling. (HubSpot, 2016)
- Buyers who use social media have larger budgets — typically 84% larger than the budgets of buyers who do not use social. (IDC, 2014)
- 61% of organizations engaged in social selling report a positive impact on revenue growth. (Feedback Systems, 2015)
- 72% of sales professionals feel that they are not proficient with social selling. (Feedback Systems, 2015)
- 46% of social sellers hit quota compared to 38% of sales reps who don’t. (Aberdeen, 2014)

OTHER ARTICLES YOU MIGHT BE INTERESTED IN

AI in Addiction Marketing: Leveraging Automation and Data-Driven Personalization
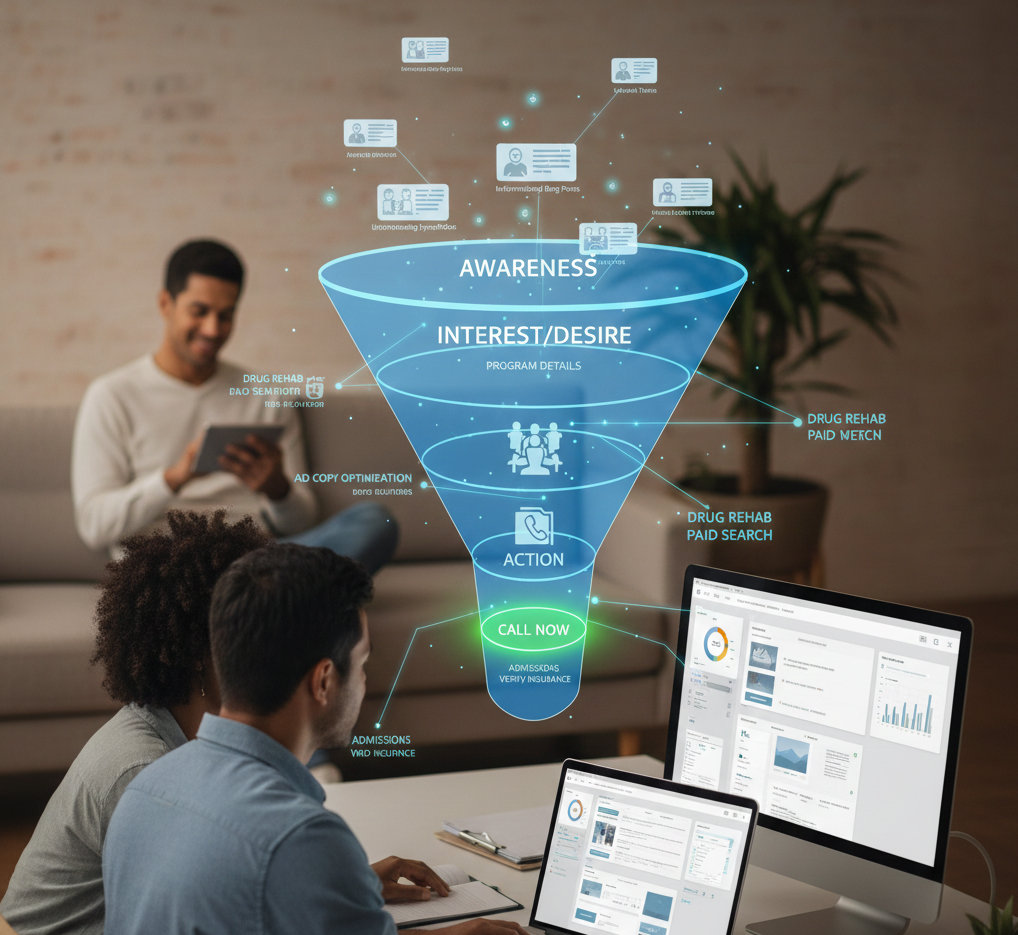
Beyond the 'Call Now' Ad: Using Funnel-Based Messaging to Nurture Drug Rehab PPC Leads

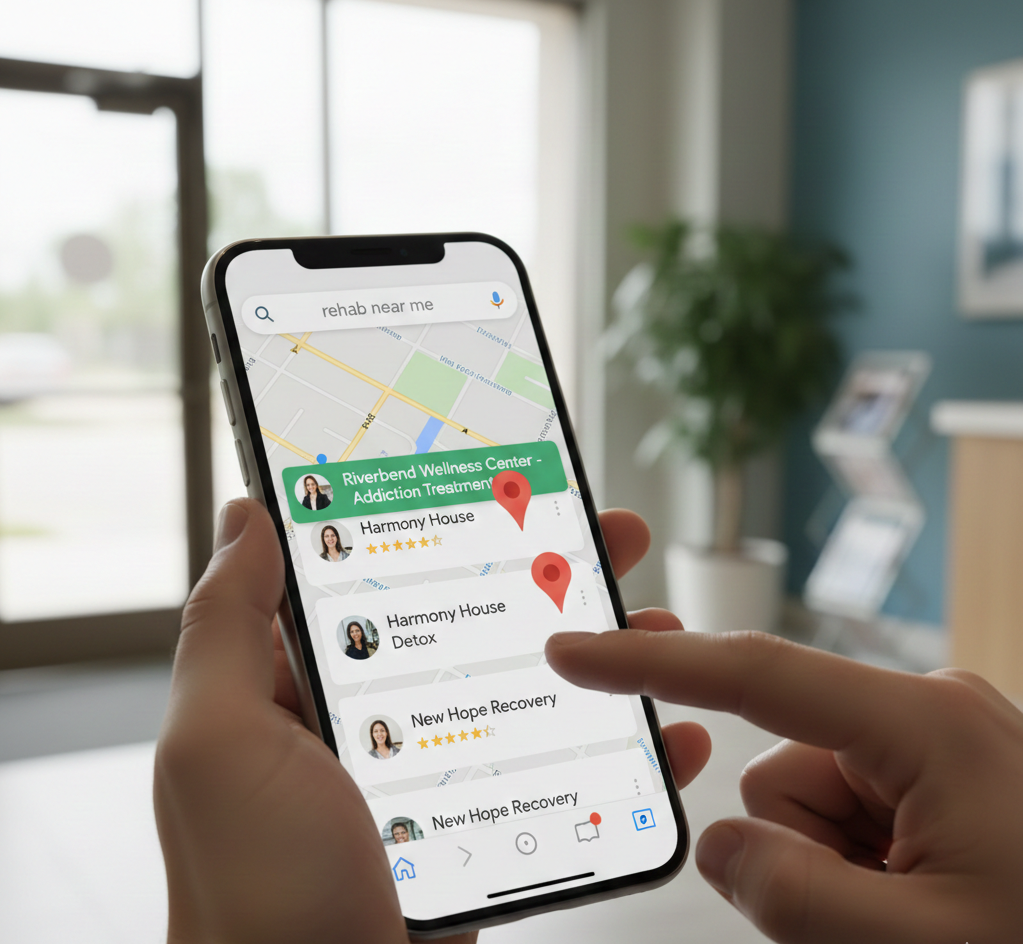
Winning the Local Search War: How to Master Google's Map Pack for Rehab Admissions
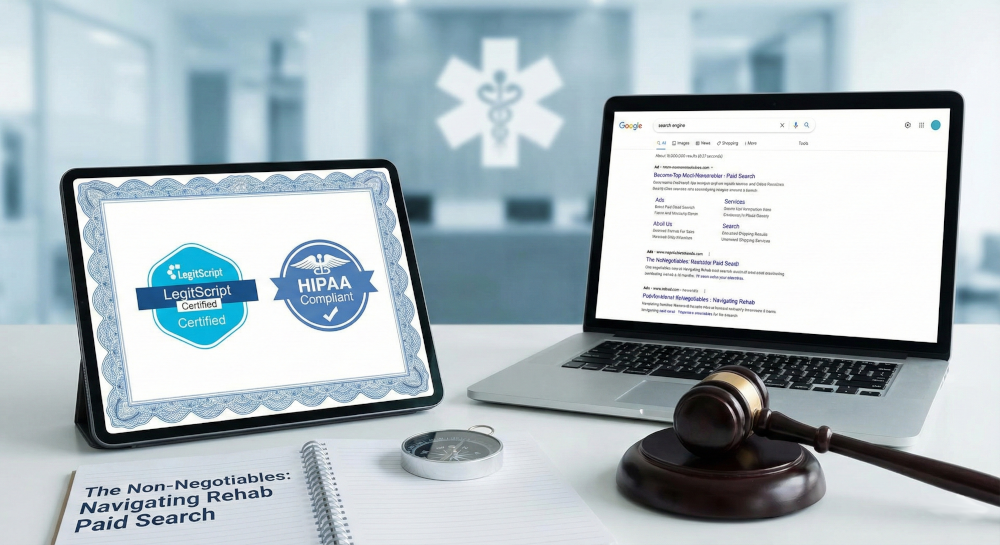
The Non-Negotiables: Navigating LegitScript and HIPAA Compliance for Drug Rehab Paid Search
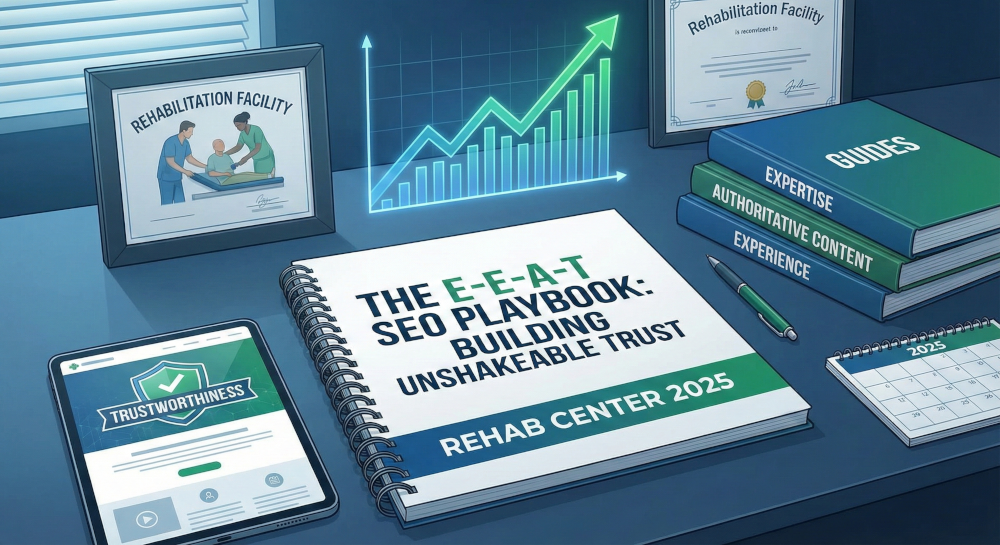
The E-E-A-T SEO Playbook: Building Unshakeable Trust for Your Rehab Center in 2025

Beyond the Bed Count: Marketing Client-Centered and Trauma-Informed Care

Contact us today to get the conversation started!